
Stop building dashboards.
Start reading them.
Insights is a fully managed BI platform for Filevine and Lead Docket users. We pull your data, build the dashboards, and keep them running. Your team builds nothing.
Dozens of firms are live in Insights right now, from small practices to some of the largest national firms in the country.
Insights pulls from everywhere your firm spends money
Case data on its own only tells you half the story. Insights connects your marketing, your intake, and your books to the same set of dashboards, so the cost of a case and the value of a case finally sit side by side.
Filevine
The full curated set: engagement and benchmarks, activity and AI usage, financial performance, data integrity, and more added every month.
Lead Docket
Several intake dashboards are live now. See where leads come from, how fast they get worked, and which sources turn into signed cases.
Google Ads
Ad spend next to the cases it produced, not just the clicks it bought. In beta with a small group of firms right now.
Curated insights for better decisions
We've distilled hundreds of charts down to the few that actually matter. Insights gives you the pulse of your business without any unnecessary noise.

Engagement score and benchmarks
Understand real user actions, with automations and bulk actions stripped out. Compare your firm to the benchmark cohort and see how the work spreads across your people, not just your total.
Activity trends, read correctly
Actions per day with a seven-day average over the top, so one quiet Monday does not read as a decline. Tells you at a glance whether the last week looks like the last quarter, and what kind of work your team is doing.


AI adoption, case by case
See which cases your team actually used AI on, which tools they reached for, and how much of your AI activity happens inside a project. Useful when you are paying for AI and want to know whether anyone is using it.
Active case inventory
Every open case by age and by phase, colored by case type. Find the matters that have been sitting in one phase too long, and see where the pipeline is backing up before it shows up in revenue.

A menu of insights
Tap into a menu of pre-curated dashboards for each practice area. Go shopping for more insights and find exact solutions to fit your team's needs. Clients vote on what we build next, and the top requests get built.
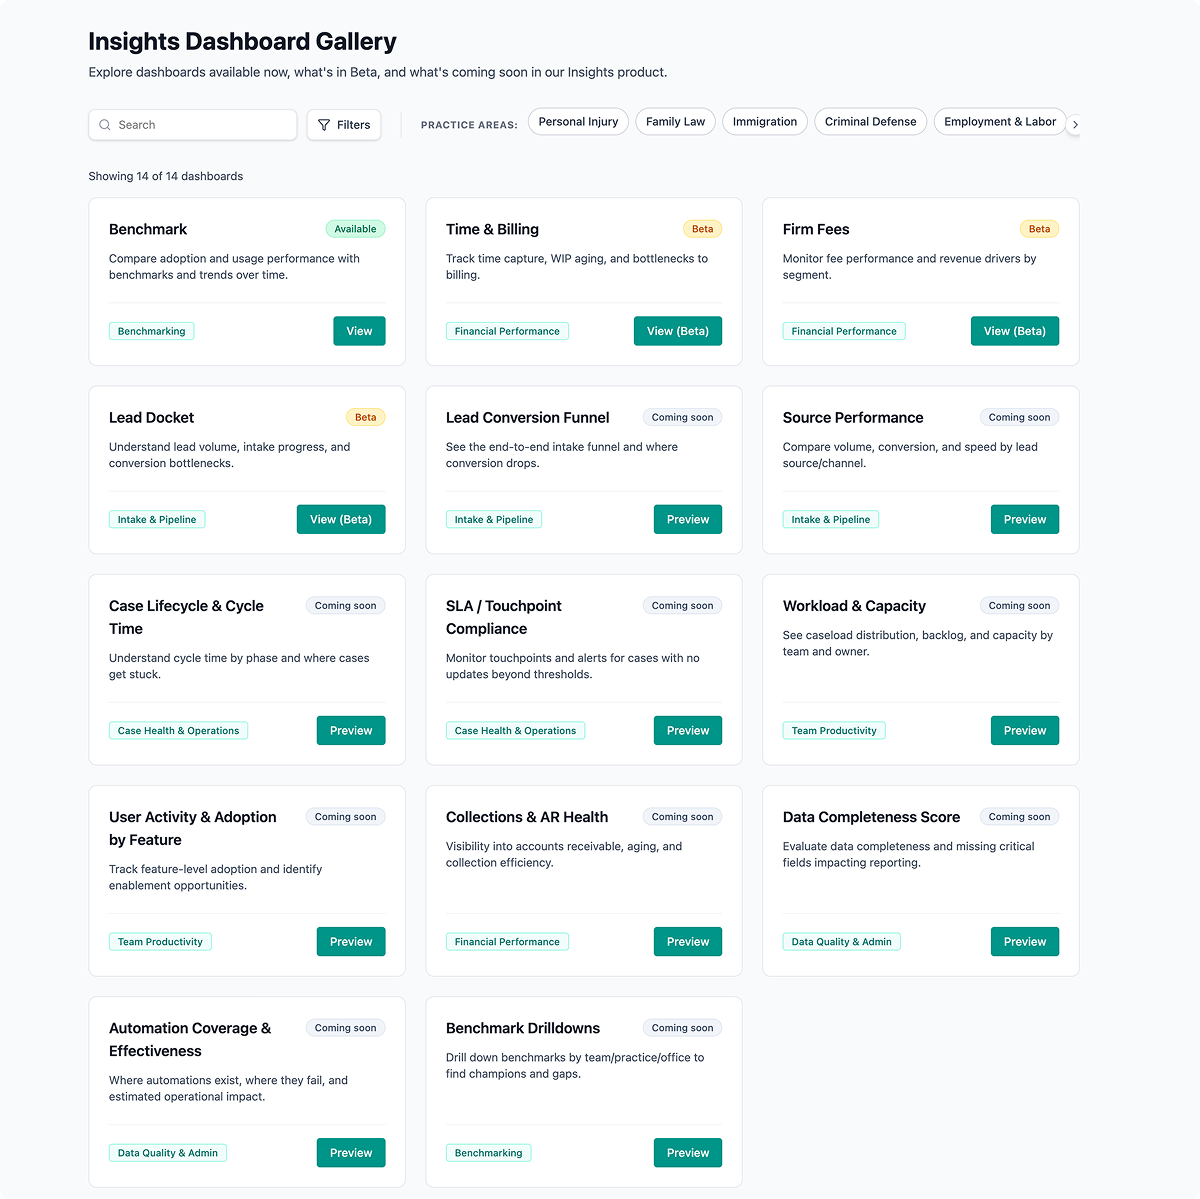
Insights that deliver actionable results
See how our curated reports and modular system provide you with the exact data you need, when you need it.
Live in 24 hours
Tell us about your firm using the form below. A day later your dashboards are running on your own data, not a demo set.
The form is right below. One of us reads it, not a bot.